Introduction: The Shift from Representation to Prediction
In the high-stakes world of industrial development, urban planning, and automated logistics, the role of 3D visualization has undergone a tectonic shift. A decade ago, the primary mandate for a studio like 3D-Ace was aesthetic representation: creating a digital image that looked enough like the proposed reality to sell an idea. Today, that is no longer sufficient.
Whether the scope involves industrial robotics or urban infrastructure, stakeholders are no longer satisfied with mere visual representation. The priority has shifted to simulation tools that reveal how a system will actually function.
We have entered the era of the predictive digital twin. In this context, simulation visualization is not merely a graphical layer; it is a rigorous computational tool that serves as a bridge between massive, abstract datasets and human decision-making.
Consequently, the engineering challenge is no longer defined by polygon counts or texture resolution, but rather by three critical pillars of performance:
- Data Throughput: The ability to ingest and process massive streams of live telemetry without latency.
- Algorithmic Efficiency: Ensuring that complex logic ranging from fluid dynamics to crowd AI runs smoothly in real-time.
- Heterogeneous Integration: The seamless unification of hardware architectures, allowing the same simulation to run on a server cluster and a tablet.
At 3D-Ace, we view simulation as a discipline that sits at the intersection of high-performance computing (HPC), cognitive ergonomics, and real-time graphics. To deliver a turnkey solution that truly meets a client’s operational needs, a development team must look beyond the game engine and understand the hardware’s engineering constraints.
Whether we are modeling the chaotic hydrodynamics of a fluid system or the emergent behaviors of a million-person crowd in a disaster scenario, the fidelity of the visual output is inextricably linked to the robustness of the underlying code.
This article provides a deep technical analysis of the methodologies required to build these pervasive, high-fidelity simulation solutions. We will dissect the challenges of scaling simulations across supercomputing clusters, the algorithmic nuances of path-finding in dynamic environments, the validation of physically based lighting for architectural compliance, and the integration of augmented reality into the industrial workflow.
Part I: The Computational Backbone: Scaling Simulation Visualization Beyond the Workstation

The first realization for any client moving from a pilot project to a production-grade simulation is that the standard workstation is a bottleneck. In scenarios requiring modeling urban crowds, where agent counts can range from thousands to millions, the computational load exceeds what a single CPU or GPU can handle in real time. We are transitioning into an era of exascale computing, and the software architectures we build must be ready for clusters housing thousands of cores.
However, scaling a simulation is not as simple as adding more hardware. The primary engineering hurdle we face at 3D-Ace is the heterogeneous nature of modern computing clusters. A typical high-performance node today is a hybrid beast, containing multi-core CPUs (such as Intel Xeon processors) alongside accelerators (such as NVIDIA GPUs or Intel Xeon Phi coprocessors).
The Trap of “Ad Hoc” Programming
The traditional approach to programming these hybrid clusters has been a patchwork of models, employing MPI for communication between nodes and CUDA or OpenCL for the specific accelerators within the node. While functional, this “ad hoc” approach creates a brittle codebase. It forces the developer to manually manage memory address spaces, explicitly handle data transfers between the host and the device, and write specific code for specific hardware. This is non-portable and prone to synchronization errors.
For our large-scale crowd simulations, we advocate a Task-Based Programming Model, specifically leveraging systems such as OmpSs. The philosophy here is to abstract the hardware complexity away from the simulation logic. In OmpSs, we do not tell the computer where to run a calculation; we simply define the calculation as a “task” and annotate its data dependencies (inputs and outputs). The runtime system dynamically schedules these tasks to available hardware resources, such as CPU cores or GPUs, and automatically handles data coherence and memory transfers.
Overcoming the Data Transfer Bottleneck
Even with a robust programming model, the hardware’s physical limitations remain. In our benchmarking of massive crowd simulations on clusters like the Minotauro supercomputer, we have identified that the critical bottleneck is rarely the raw floating-point performance. It is the PCIe bus.
Transferring the state data of millions of agents between the CPU (which might handle high-level logic) and the GPU (which handles the physics and rendering) creates a traffic jam. Even with Generation 3.0 PCIe interfaces, the bandwidth is finite. To maintain a real-time frame rate (30+ FPS) with millions of entities, we use Double-Tiling with Computation/Communication Overlap.
Instead of treating the simulation space as one giant block, we partition the navigation mesh into tiles. The system processes the “interior” of a tile (data that doesn’t affect neighbors) while simultaneously asynchronously transferring the “halo” or “border” data needed by neighboring tiles. By overlapping computation and data transfer, we can effectively “hide” the PCIe bus’s latency. This architectural foresight enables linear scalability. Doubling hardware resources results in a direct doubling of simulation speed, a metric that is notoriously difficult to achieve in legacy game engines.
Part II: Algorithmic Efficiency in Path-Finding
Hardware can solve the throughput problem, but it cannot fix a fundamentally inefficient algorithm. In the domain of crowd simulation and logistics planning, Path-Finding is the single most expensive operation.
The industry standard, A* (A-Star), is a powerful heuristic, but it collapses at scale. If you are simulating a city block with 100,000 agents, and a disaster event triggers a simultaneous evacuation, asking the system to calculate 100,000 A* paths instantly will freeze even the most powerful cluster. The search space is simply too granular; the algorithm wastes cycles by exploring every grid cell or navigation-mesh polygon.
To solve this, 3D-Ace implements Hierarchical Path-Finding (HPV). This approach mimics human cognition. When a person plans a route from their office to a train station across the city, they do not calculate every single step or every sidewalk crack. They plan a high-level route: “Exit Building -> Go to Main Street -> Turn Left at Park -> Arrive Station.”
The Connectivity Bitmask Innovation
Our implementation of HPV pre-processes the environment into a multi-level abstract graph. We divide the map into blocks (e.g., 4×4, 16×16 cells). The critical innovation lies in how we store the relationships between these blocks. We utilize a Connectivity Bitmask.
For every block in the hierarchy, we store a compact 64-bit integer. These bits encode the exact connectivity between the block’s borders. By checking these bits, the path-finding algorithm can instantly determine whether crossing from the North border of a block to its East border is possible without traversing the block’s internal cells.
This has profound implications for performance:
- Early Pruning: If the high-level search determines that two sectors of a factory or city are unconnected (perhaps due to a security door or a roadblock), the algorithm discards that entire branch of the search tree immediately. It never wastes time looking for a path that doesn’t exist.
- Memory Footprint: Using bitmasks rather than heavy graph objects at higher levels keeps the memory requirement minuscule. This allows us to keep the entire navigation hierarchy in the processor’s fast L2/L3 cache, avoiding slow RAM access.
- Dynamic Replanning: In a simulation of a collapsing building or a changing factory floor, obstacles appear dynamically. With HPV, we only need to update the bitmasks for the affected blocks. The agents can then locally re-plan their route without the system needing to recalculate the global path from scratch.
Our internal tests have shown that this hierarchical approach yields a speed-up factor of approximately 6x compared to standard grid-based A*, with a sub-optimality error of less than 1%. For a client needing to simulate a stadium evacuation, that speed difference is the gap between a real-time training tool and a lagging, unusable tech demo.
Part III: From “Zombie” Agents to Data-Driven Behavior
A simulation is only as good as its underlying logic. In the past, “crowd simulation” often meant “particles that avoid colliding.” Agents would wander aimlessly, resembling zombies more than humans. This is unacceptable for professional applications, including retail analysis and transport planning. The agents must exhibit intention, cultural nuance, and realistic trajectory patterns.
At 3D-Ace, we move away from purely synthetic heuristics and embrace Data-Driven Simulation. We utilize vast datasets of real-world human movement, such as the GeoLife GPS trajectory dataset, to train our agents.
The “Big Data” Cleaning Pipeline
Raw GPS data is noisy and messy. To make it usable, we employ a Big Data processing pipeline. We use tools like Pig Latin to write declarative scripts that filter and structure this data. We extract tuples containing User ID, Timestamp, Longitude, Latitude, and Transportation Mode.
By analyzing millions of these real-world trajectories, we generate probability heatmaps and transition matrices. We can determine, statistically, that a pedestrian in a specific district at 8:00 AM is 85% likely to head toward a transit hub and move at an average speed of 1.4 meters per second. When we instantiate a virtual agent, they inherit these statistical properties. They do not just “wander”; they commute.
Anthropometry and Social Physics
Furthermore, we must account for the physical reality of the human body, specifically Anthropometry. A crowd is not a collection of uniform cylinders. It is a mix of varying body sizes, from children to large adults, often carrying luggage or pushing strollers.
In high-density simulations, such as the Hajj pilgrimage or a subway station rush hour, the “Compressible Flow” of the crowd is dictated by these physical dimensions. We also model Social Forces: the tendency of groups (families, friends) to maintain cohesion. A group of four will move more slowly and occupy more space than four individual agents because they actively resist separation. By coding these “micro-behaviors” into the simulation loop, we can predict bottlenecks that a standard model would miss, such as the turbulence caused by a family stopping to regroup in a narrow corridor.
Part IV: The Architecture of Simulation Visualization Delivery
Once the simulation is running on the cluster and the agents are behaving intelligently, the final engineering challenge is Delivery. How do we get the visual output to the user?
The answer depends entirely on the client’s use case. We categorize our visualization pipelines into three distinct architectures: In-Situ, Streaming, and Web-Based.
1. In-Situ Visualization (The Analyst’s Choice)
We use In-Situ visualization for the heaviest simulations, analyzing terabytes of data post-mortem or in real time on the supercomputer itself. In this model, rendering occurs on the same nodes that perform the simulation.
We utilize Off-Screen Rendering to generate frames directly on the cluster’s GPUs. These frames (color and depth) are then composited using a Sort-Last Depth Compositing algorithm. This is technically demanding because it requires synchronizing the frame buffers of hundreds of GPUs. However, it eliminates the need to move the raw geometry data over the network. The user, viewing remotely via VirtualGL, sees a pristine, high-resolution video stream with zero compression artifacts in the geometry.
![]()
2. Streaming State Data (The Designer’s Choice)
For clients who need to interact with the simulation by changing parameters on the fly, we often decouple the engine. The heavy math (agent positions, physics) runs on the cluster, but the state data is streamed to a local high-end workstation.
The workstation runs the visualization engine (e.g., Unity or Unreal). To handle network jitter, we implement client-side Interpolation. The client engine buffers incoming state updates and smooths agent movement between time steps. This ensures that even if the network creates a 100ms packet delay, the visual flow remains fluid.
![]()
3. Web-Based Delivery (The Democratized Choice)
Increasingly, clients require access via thin clients, such as tablets or laptops without dedicated GPUs. Here, we adopt a “Cloud Gaming” architecture.
The server renders the scene, but the client controls the camera. The client sends a lightweight packet (Camera Position, Rotation, Zoom) via WebSocket. The server renders the frame for that specific viewpoint and streams it back as a video stream.
Crucially, our Client Pipeline is smart. We don’t just stream video; we can stream the depth buffer and camera parameters. This allows the web browser, using WebGL or CesiumJS, to composite local data, such as a UI overlay or a static map, on top of the server-streamed video with perfect occlusion. This capability enables a city official to click on a “video” of a building and receive metadata, because the browser knows the depth of the pixel they clicked.
Ready to see the future? Reach out to discus our custom simulation visualization solutions.
Part V: Validating Reality – The Challenge of Daylighting
While crowd dynamics are fluid, the static environment, specifically lighting, presents its own rigorous challenges, particularly for our architectural clients. “Looking realistic” is not the same as “being accurate.” A game engine can make a room look beautifully lit with baked textures, but that is useless for an architect trying to achieve LEED certification or analyze glare risks.
We specialize in Physically Based Daylighting Simulation. This requires a departure from standard RGB rendering. Light is a spectrum, and materials are complex.
Navigating Input Uncertainty
The biggest enemy of accuracy is input data. Standard “Sky Models” (like the CIE Overcast or CIE Clear Sky) are mathematical idealizations. Real skies are chaotic. To improve accuracy, we often employ the Perez All-Weather Sky Model, which uses local weather station data (direct and diffuse irradiance) to parameterize the luminance distribution of the virtual sky dome.
Similarly, we cannot rely on simple “texture maps” for windows and facades. We must model the Bidirectional Scattering Distribution Function (BSDF) of the materials. A complex glazing system on a skyscraper directs light differently depending on the angle of incidence. If we simplify this to a single transparency value, the simulation is worthless.
The Validation Loop
We use metrics like Daylight Autonomy (DA), defined as the percentage of annual daytime hours that a specific point in a space receives sufficient daylight, and Useful Daylight Illuminance (UDI).
Because simulation engines (using Radiosity or Raytracing) involve inherent approximations, we practice rigorous validation. We compare our simulation outputs against benchmarked datasets and real-world measurements. We perform Sensitivity Analysis to tell the client: “The uncertainty in your glass material properties introduces a ±5% margin of error in your energy efficiency calculation.” This transparency is what separates an engineering partner from a graphics vendor.
Part VI: The Digital Factory and Augmented Reality

Moving from the macro scale of the city to the micro scale of the factory floor, the requirements shift toward precision and integration with automation hardware. This is the domain of the Digital Factory.
Hardware-in-the-Loop (HIL)
For our manufacturing clients, we integrate simulation directly with industrial control systems. Using platforms compatible with IEC Ladder Logic (such as the ecosystems around Omron’s Sysmac Studio), we can create 3D visualizations driven by the actual code running the factory.
We model the kinematics of a pick-and-place robot, the friction of a conveyor belt, and the pneumatics of a gripper. When the client runs their PLC (Programmable Logic Controller) code, the 3D model reacts in real-time. This allows for Virtual Commissioning. An engineer can debug the logic of a complex assembly line by checking for collisions, timing errors, or logic deadlocks before a single piece of physical metal is cut. This drastically reduces the “ramp-up” time for new production facilities.
AR and the Depth Problem
On the shop floor itself, we are pushing the boundaries of Augmented Reality (AR) for maintenance and flow analysis. Imagine an engineer looking at a physical pipe and seeing a visualization of the fluid pressure inside it, overlaid in real time.
However, standard AR has a fatal flaw in industrial settings: Depth Perception and Occlusion. When a user taps a physical pipe on their tablet screen to “select” it, the computer vision algorithm often gets confused by the lack of texture on the metal and selects the wall behind it instead. This misalignment breaks the illusion and makes data retrieval impossible.
To solve this, 3D-Ace employs the OpenVisFlow methodology, utilizing a geometric correction algorithm. We assume the user is interested in the object in the foreground. We mathematically define the simulation plane. When the user interacts with the screen, we do not just cast a ray into the void; we project the interaction point onto the defined simulation plane using the formula:
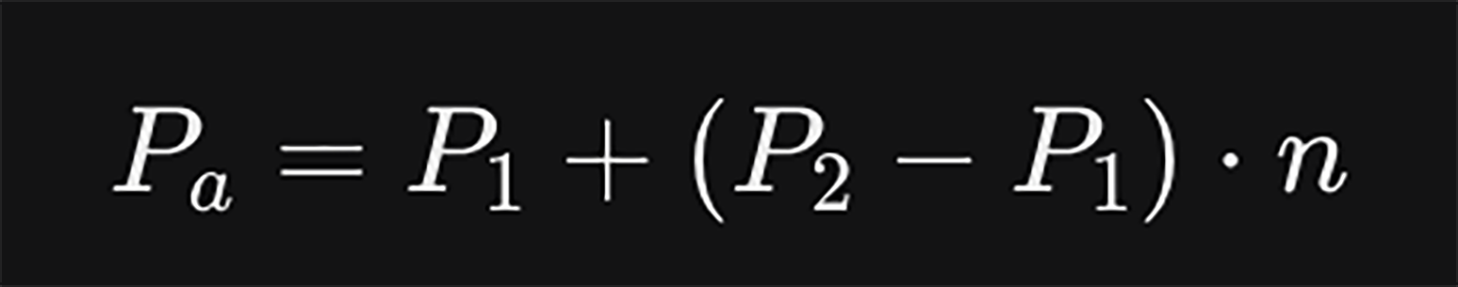
Where Pa is the corrected point, and n represents the projection factor based on the plane’s normal. This simple yet critical math ensures the fluid flow visualization “sticks” perfectly to the physical machine, regardless of the camera angle or lighting conditions.
Part VII: Decision Modeling and Business Logic
Finally, a simulation is incomplete if it fails to account for the system’s governing rules. Beyond physics and crowds, there is Business Logic.
For clients in finance, insurance, and strategic planning, we integrate Decision Model and Notation (DMN) into our visualizations. We don’t just simulate the car crash; we simulate the insurance adjudication process that follows. By modeling inputs (Driver Age, Risk History, Weather Conditions) and routing them through a decision table (as defined in standards like Enterprise Architect), we can visualize the “invisible” flow of decisions.
This creates a holistic dashboard. A client can see the physical simulation on one screen (the car moving, the factory operating) and the logic simulation on another (the risk assessment changing, the profit margin fluctuating). This is the ultimate goal of the dashboard: to provide a Multi-Objective Optimization view that makes the trade-offs between physical performance and business costs visible.
Conclusion: The 3D-Ace Philosophy
Creating a simulation visualization system is a complex orchestration of disparate technologies. It requires the ability to write low-level C++ for a supercomputer node, high-level shader code for a realistic sky, and structured logic for a business rule engine.
It requires a team that understands that Latency is the enemy, that Data must be cleaned, and that Validation is non-negotiable.
At 3D-Ace, we do not simply license a tool and hit “render.” We build the pipeline. We customize the path-finding to fit the specific sociology of your crowd. We tweak the navigation mesh bitmasks to squeeze the most performance out of your hardware. We calibrate the spectral rendering of your windows to ensure your environmental certification is safe.
In a world drowning in data, visualization is the only way to stay afloat. However, it must be the right visualization, engineered for speed, validated for accuracy, and designed for decision-making. That is the service we provide. We turn the invisible math of your business into a visible, navigable, and predictable reality.
Part VIII: The Future of Pervasive Simulation
As we look toward the horizon of simulation technology, the next frontier is Pervasiveness. The goal is to decouple high-fidelity simulation from the control room and bring it into the field, putting the power of prediction in the operator’s hands on the ground. This concept, often referred to as “Simulation at the Edge,” requires a fundamental rethinking of how humans interact with complex data.
The Human-in-the-Loop
The most sophisticated algorithm is useless if the user interface acts as a barrier. At 3D-Ace, we emphasize the Human-in-the-Loop design philosophy. In many legacy industrial simulations, the “user” is treated as a passive observer who sets initial parameters and waits for a video output. In modern pervasive simulation, the user is an active participant.
Consider a disaster response coordinator using a tablet in a field tent. They need to run a flood simulation. They cannot deal with a complex command-line interface or a cluttered desktop UI. They need Cognitive Adaptation. Our visualization interfaces are designed to adapt to the context. If the user is on a mobile device, we simplify the control scheme by using touch gestures and reducing visual noise to focus on key metrics (e.g., water depth, evacuation routes). If they are in a VR command center, we expand the interface to offer deep-dive analytics.
This adaptation extends to the simulation logic itself. We are exploring systems that learn from the user’s interventions. If a traffic controller consistently overrides the simulation’s suggestion to close a specific bridge, the system records this preference. Over time, the “Digital Human Model” of the operator becomes part of the loop, enabling the simulation to anticipate human decisions rather than merely react to physics.
Simulation Visualization for the Mobile Edge
Making simulation pervasive also means mastering the constraints of mobile hardware. While we utilize supercomputers for the heavy lifting, client devices such as smartphones or AR headsets have strict thermal and battery limits.
We employ aggressive Level-of-Detail (LOD) management not just for geometry, but for information. On a small screen, displaying the trajectory of every single agent in a 100,000-person crowd is not just computationally expensive; it is cognitively overwhelming. It creates “visual clutter” that obscures insight.
We implement Visual Abstraction techniques. On a zoomed-out mobile view, the crowd is rendered as a fluid density map, functioning as a heatmap of flow. As the user zooms in, the abstraction peels away, revealing individual agents. This “Semantic Zoom” ensures that the rendering load matches the device’s capabilities while ensuring the user always sees the most relevant data representation for their current perspective.
The Integration of Sensor Networks
The final piece of the pervasive puzzle is the real-time link to the physical world via the Internet of Things (IoT). A Digital Twin is only a “Twin” if it remains synchronized with its sibling.
We build pipelines that ingest live sensor data, such as temperature readings from a turbine, occupancy sensors in a building, and traffic flow data from smart cameras, and inject them into the running simulation.
This creates a Symbiotic Simulation. The virtual model corrects itself based on reality. If the simulation predicts a temperature of 50°C but the sensor reads 60°C, the system triggers an anomaly alert and automatically adjusts its internal friction parameters to match the observed reality. This capability turns a static planning tool into a dynamic operational monitor that can detect invisible faults before they become catastrophic failures.
Part IX: Collaborative Engineering and Education
The complexity of these systems necessitates a collaborative approach. No single engineer holds all the answers. The visualization platform must serve as a common language between the diverse stakeholders of a project: the structural engineer, the architect, the financial planner, and the safety inspector.
The Virtual Meeting Ground
We leverage networked visualization to create Collaborative Virtual Environments (CVEs). Instead of sending static reports back and forth, stakeholders meet inside the simulation.
In a VR-enabled review session, the architect can point to a shadow cast on a solar panel, and the electrical engineer sees it in real time. They can collaborate on the design by moving a wall or changing a material, and see the simulation update instantly. This Synchronous Collaboration reduces the cycle time of design iterations from weeks to hours.
Simulation as a Training Tool
Finally, we must not overlook the educational value of high-fidelity visualization. The same assets used to design a facility can be repurposed to train its operators.
By connecting the “Digital Factory” simulation to a learning management system, we create immersive training scenarios. A new operator can learn to troubleshoot a robotic arm malfunction in a safe, virtual environment. Because the simulation is driven by the actual IEC ladder logic and physics, the skills they acquire are directly transferable to the real machine. They learn the “feel” of the system, including the timing, the visual cues of a jam, and the sequence of operations, without the risk of damaging expensive hardware or causing injury.
This duality of “Design once, Use everywhere” is central to the value proposition we offer at 3D-Ace. The investment in high-quality simulation visualization is amortized across the entire lifecycle of the project, from the initial conceptual design through daily operations to the training of the next generation of staff.
The Value of 3D-Ace Simulation Visualization Services
The landscape of simulation visualization is vast, ranging from the nanoseconds of a processor cycle to the decades of a building’s lifecycle. It encompasses the hard math of bitmasks and BSDFs, as well as the soft science of human behavior and cognitive ergonomics.
For the client, navigating this landscape can be daunting. The temptation to settle for “good enough” visuals or “black box” solutions is strong. But as we have explored, the distinction between a generic visualization and an engineered, data-driven simulation is between a guess and a guarantee.
At 3D-Ace, our expertise as a 3D modeling company is not just in making things look real; it is in making them act real. We understand the specific architectures of HPC clusters and how to exploit them with OmpSs. We know how to clean and utilize Big Data to drive realistic agent behavior. We have the photometric knowledge to validate lighting for critical architectural decisions. And we possess the software engineering discipline to integrate these simulations into the industrial IoT and AR workflows that define Industry 4.0.
We invite you to look beyond the surface. Contact us, and let us build the deep, predictive, and pervasive simulation systems that will drive your business into the future.